Phase 1: THINK — Frame the Problem Intelligently
Focus on understanding the “why” and “what” before diving into “how.”
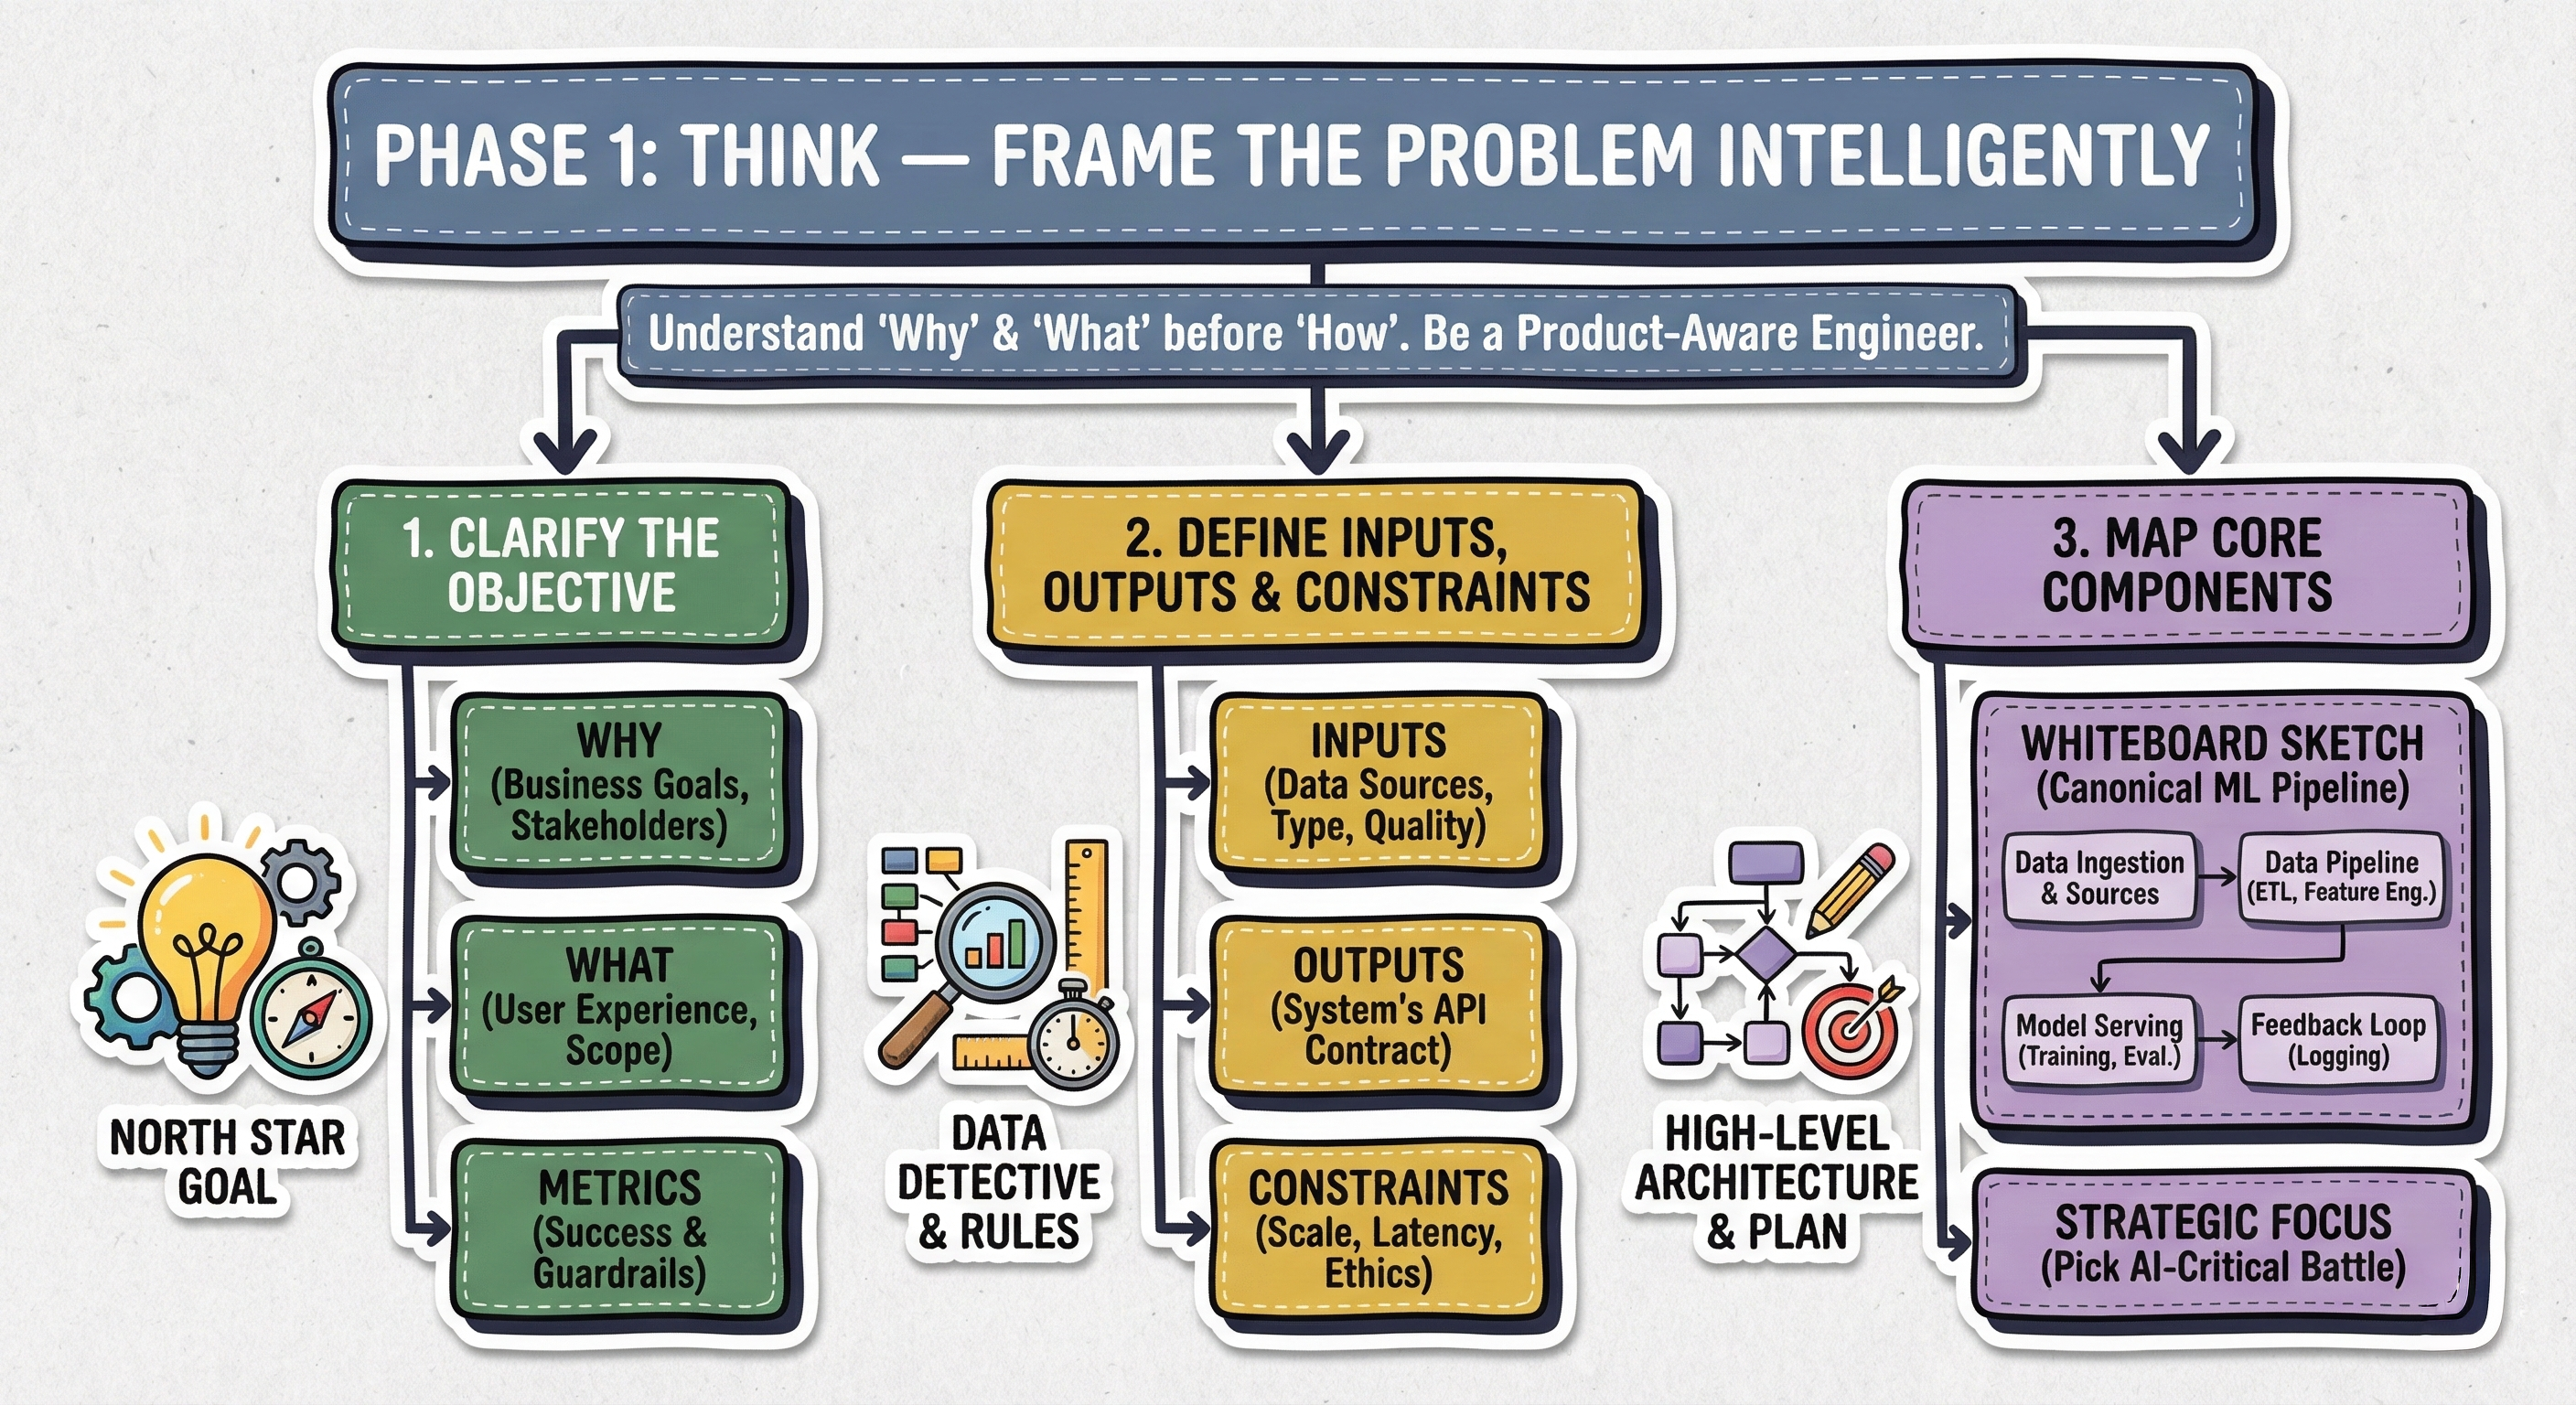
This phase is about acting like a product-aware engineer, not just a model-builder. You will take charge of the conversation, ask clarifying questions, and define the "North Star" or main goal for the system. This involves three key steps:
Clarify the Objective: Uncover the business goals, identify stakeholders, define the user experience, and establish the specific success and guardrail metrics.
Define Inputs, Outputs & Constraints: Act as a data detective to determine what data is available (inputs), what the system must deliver (outputs), and what rules you must follow (constraints like latency, scale, and privacy).
Map Core Components: Sketch the high-level, 30,000-foot view of the entire system, mapping the logical blocks from data ingestion to the feedback loop. This map serves as your plan of attack for the rest of the interview.
1.1. Clarify the Objective
Welcome to the most important five minutes of your interview. Jumping directly into model selection (e.g., "I'll use a Transformer!") or data pipelines without defining what success means is the most common mistake good engineers make.
Interviewers give you a vague prompt on purpose, like "Design a personalized news feed" (Q1) or "Design a fraud detection system" (Q19). This is a test. They want to see if you will start working based on your own assumptions (which are probably wrong) or if you will take charge and lead the conversation like a senior engineer.
Your goal here is to be proactive, not reactive. You are acting as a "product-aware engineer." This shows you understand why you are building something, not just how to build it. Think of this step as defining the "North Star" or main goal for your system. Every choice you make later, your model, your data, your speed requirementsmust support the goals you set right now.
Here is how you break down the problem step-by-step.
1. The "Why": Uncover Business Goals & Stakeholders
First, connect the AI system to its business purpose. An AI system is not a research project; it's a product feature designed to achieve a business goal. Your first questions should explore this.
For a News Feed (Q1): "What is the primary business goal for this feed? Are we trying to maximize short-term engagement (like clicks and likes), long-term retention (making sure users come back tomorrow), or revenue (maximizing ad views and clicks)?"
For Fraud Detection (Q19): "What is the key objective? Is it to minimize financial losses from fraud, or is it to minimize user friction by reducing the number of legitimate transactions we block?"
Often, these goals conflict with each other. For example, a feed focused on short-term clicks might show "clickbait," which hurts long-term user trust. You should point out this conflict.
A more advanced technique is to identify all the stakeholders.
For a Marketplace like Airbnb (Q6): This is a multi-stakeholder problem. "Are we optimizing for the guest (highest conversion, best price), the host (fair exposure, maximizing bookings), or the platform (revenue, safety, and trust)?"
Asking this shows you are thinking at a high level. It shows you see the system as a complex environment, not just a simple ranking problem.
2. The "What": Define the User Experience & Scope
Next, turn the business goal into a clear user experience and define the problem's limits.
User Experience: How should the system feel to the user?
For Spotify Recommendations (Q5): Should it feel hyper-personalized and relevant (showing you more of what you already love), or should it prioritize discovery and serendipity (introducing you to new artists you might not find otherwise)?
For Content Moderation (Q14): The user experience goal is safety and trust. The system should be invisible when it works and fair when it intervenes.
User Personas: Who is the target user?
For LinkedIn Job Recommendations (Q4): Is the user a new graduate (who values discovery and a wide range of options) or a senior executive (who values precision, relevance, and confidentiality)? The "right" recommendation is completely different for each.
Scope & Surface Area: Where and when does the user interact with this system?
For Real-Time Translation (Q13): "Is this for text-to-text chat, where latency can be ~500ms? Or is this for real-time voice-to-voice calls, where sub-100ms latency is critical and we have to handle audio processing?"
For RAG System (Q8): "Is this an internal tool for expert researchers (who value accuracy and source citation) or a public-facing chatbot (who values conversational tone and speed)?"
3. The "How": Establish Success & Guardrail Metrics
This is where you define specific measurements. How will you measure the goals you just defined? You need metrics for the product, the model, and the system's operation.
Product/Business Metrics (The "Goal"): These are the high-level goals you use in an A/B test to prove the system is working.
Engagement/Retention: Daily Active Users (DAU), time spent, scroll depth, D1/D7 retention.
Conversion: Click-Through Rate (CTR), purchase rate, job application rate.
Trust & Safety: Block/hide rate, report rate, user appeals.
AI/Model Metrics (The "Levers"): These are offline metrics you use to train and evaluate your model. They are stand-ins (or proxies) for your main product metrics.
Ranking (Q1, Q6): NDCG or MAP (measures the quality of the entire ranked list).
Classification (Q14, Q19, Q22): Precision and Recall. This is a classic trade-off you must discuss.
Example for Spam Detection (Q22): A False Positive (a critical email goes to spam) is much worse than a False Negative (one spam email gets in the inbox). Therefore, we must optimize for extremely high Precision (e.g., 99.99%), even at the cost of lower Recall.
Generation (Q11): BLEU/ROUGE (for similarity) or, more importantly, Human Evaluation (for helpfulness, safety, and factuality).
Guardrail Metrics (The "Constraints"): These are metrics you watch to make sure you are not causing new problems.
"While we optimize for time spent, we must add a guardrail metric for 'report post' clicks to ensure we aren't just promoting polarizing content."
"We want to maximize CTR on job ads, but we must have a guardrail for fairness to ensure we are showing opportunities equitably across different demographics."
Operational Metrics (The "Budget"):
Latency: "What is our latency budget? For a real-time feed, predictions must be returned in <200ms."
Scale/Throughput: "What scale are we handling? Billions of requests per day?"
Cost: "Is there a hard constraint on inference cost per user?"
By spending these important first five minutes clarifying the objective, you have created a scorecard for your design. You've shown you are a system-builder and product-owner, not just a model-builder. You have a clear North Star, a defined scope, and a way to measure success. Now, and only now, are you ready to talk about data.
1.2. Define Inputs, Outputs & Constraints
You've successfully defined the "North Star" in step one. You know the business goal (e.g., "increase long-term retention") and the metrics (e.g., "D7 retention" and "NDCG"). Now, you must connect that high-level goal to the technical details.
This step is where you show you're not just a machine learning scientist but a practical engineer. It’s easy to design a system with perfect, abundant data and infinite compute. The interviewer wants to see how you handle the messy, incomplete, and resource-limited reality of a real company.
This is your "scoping" phase. You are defining the materials you have to work with (Inputs), the exact product you must deliver (Outputs), and the rules of the game you must follow (Constraints).
1. Inputs: The Fuel for Your AI Engine
No ML system exists without data. "Garbage in, garbage out" is a common saying for a reason. Your first job is to act like a data detective. You must ask questions to uncover the what, where, when, and how of the data.
Data Sources & Availability: What data do we actually have access to?
Example for a News Feed (Q1): "I'll assume we have three main data categories. First, User Data: profile information, demographics, social graph (who they follow). Second, Item Data: the articles/videos themselves, their metadata (publisher, topic, category, age). Third, and most importantly, Interaction Data: implicit signals like clicks, dwell time, and likes, and explicit signals like shares, comments, or 'show me less of this'."
Pro-Tip: Don't just list data. Categorize it. This shows structured thinking.
Data Modality & Format: What form is the data in?
Is it structured/tabular (e.g., transaction records for fraud detection, Q19)?
Is it text (e.g., user reviews for content moderation, Q14)?
Is it images or video (e.g., for multi-modal search, Q9)?
Naming the data type is important because it directly justifies your model choice later. "Because we are dealing with multi-modal search, I'll need separate encoders for text and images, like a BERT model and a ViT, which we can project into a shared embedding space."
Data Velocity (Batch vs. Streaming): This is a major architectural choice.
Batch Data: "User profile features, like 'age' or 'location', are probably updated in a nightly batch job. We can consume these from a data warehouse."
Streaming Data: "User interactions, like 'clicks' or 'likes', are arriving in real-time. To make the feed responsive, we must capture these events. This implies a need for a streaming infrastructure like Kafka and a real-time feature store. We can't wait 24 hours to know a user liked an article."
Asking this question shows you are thinking about data freshness, a key driver of model performance.
Data Quality & The "Messy Reality": This is where you score bonus points. Never assume the data is clean.
Missing Values: "A huge challenge will be the cold start problem. What do we show a brand new user who has no interaction history? We'll need a fallback strategy, perhaps showing globally popular items."
Biased/Skewed Data: "For Fraud Detection (Q19), the dataset will be extremely imbalanced—>99.9% of transactions are legitimate. This means 'accuracy' is a useless metric. We must focus on Precision/Recall and use techniques like SMOTE or focus on anomaly detection models."
Noisy/Subjective Labels: "For Hate Speech Detection (Q14), our labels from moderators will be subjective. We'll need a robust labeling guideline and a process for auditing inter-moderator agreement."
2. Outputs: The System's "API Contract"
What, exactly, will your system deliver? Defining this clarifies the system's boundary and prevents scope creep.
Example for a News Feed (Q1): "The output isn't just one article. The downstream service will send my system a
user_id, and my system will return a ranked list of 100item_ids."Example for Fraud Detection (Q19): "The output isn't just a binary 'fraud/not-fraud' label. A much more useful output is a risk score (a float from 0.0 to 1.0). This allows the downstream business logic to be flexible: scores > 0.99 might be an 'auto-block', while scores from 0.8 to 0.99 might trigger a 'challenge' (like a 2FA prompt), and everything else is 'auto-allow'."
Example for a RAG System (Q8): "The output is not just the generated text. To build trust, the output must be a JSON object containing the answer string and a list of source citations (document IDs, page numbers) used to generate that answer."
3. Constraints: The Rules of the Game
Constraints are not problems; they are the design problem. This is where you show senior-level thinking by focusing on trade-offs.
Scale & Latency (The Performance Budget):
Scale: "How many users? Billions? (Q1)" "How many new items per day? Millions?" This dictates your entire architecture. "At this scale, we can't re-rank all items for all users. We must use a multi-stage architecture: a fast candidate generation/retrieval stage to select ~1,000 items, followed by a slower, more complex ranking stage to score those 1,000 and pick the top 100."
Latency: "What is our latency budget? For a real-time feed, the p99 latency (from request to response) must be under 200ms." This budget dictates your model choice. "A giant 100B-parameter LLM is too slow for real-time inference. We'll need to use a smaller, distilled model, or apply techniques like quantization."
Privacy, Fairness & Ethics (The "Do No Harm" Budget):
Bring this up yourself. Do not wait to be asked.
Privacy (PII): "For a Healthcare Assistant (Q12), we are dealing with highly sensitive PII. We cannot train on raw patient data. We must enforce strict anonymization, PII masking, and potentially use differential privacy. All data must stay within a secure, compliant environment."
Fairness: "For Job Recommendations (Q4) or Marketplace Ranking (Q6), the model can inadvertently learn and amplify historical biases. We must define fairness constraints. For example, we'll need to monitor and ensure that qualified candidates from different demographics are shown at equitable rates. This links back to the guardrail metrics we defined in Step 1."
By the end of this step, you and the interviewer are on the exact same page. You've gone from a vague prompt to a well-defined technical problem. You have your materials (inputs), your deliverable (outputs), and your rules (constraints). Now you are ready to build.
1.3. Map Core Components
You’ve done the foundational work. You’ve defined the "North Star", the business objectives and metrics (Step 1). You’ve grounded that goal in reality by scoping your inputs, outputs, and constraints (Step 2).
Now, you go to the whiteboard.
This step is your "30,000-foot view." It's the moment you sketch the high-level architecture that connects your Inputs to your Outputs. This is not the time to debate specific algorithms (like "I'll use the Adam optimizer") or specific tools (like "I'll use AWS S3"). Instead, you are drawing the logical blocks of your system.
Why is this so important? Because it proves you are an architect, not just a coder. You are showing the interviewer your plan of attack for the entire rest of the interview. This map serves as a "table of contents" for Phase 2. It shows structured thinking and gives your interviewer confidence that you know how to build a large-scale system from end to end.
You can frame this by saying, "Now that we have our goals and constraints, let's sketch the high-level, end-to-end architecture. I see five core logical components."
1. The "Whiteboard Sketch": The Canonical ML Pipeline
Your sketch should almost always include these five blocks. This structure is the foundation of nearly every production AI system.
Data Ingestion & Sources: This block represents the start of your pipeline, connecting directly to the "Inputs" you defined.
Example for a News Feed (Q1): "On the far left, we have our Data Sources. This will include streaming data, like user clicks, likes, and shares, flowing in from our app via a message queue like Kafka. It also includes batch data, like user profile updates or the article metadata, which we can pull nightly from a data warehouse."
Data Pipeline (ETL & Feature Engineering): This is the heart of your data preparation. It's not one single block; it's a dual pipeline.
Offline Pipeline: "This is a batch process, probably using Spark, that runs daily. It consumes all the historical data to compute complex, historical features. For example, 'user's favorite topic over the last 30 days' or 'article's 7-day click-through rate'. These features are then saved to an Offline Feature Store."
Online Pipeline: "This is a streaming process, using something like Flink, that consumes from Kafka. It computes fresh, real-time features, like 'user's activity in the last 5 minutes' or 'topics this user is currently clicking on'. These are saved to a low-latency Online Feature Store (like Redis)."
Why this is impressive: Distinguishing between online and offline feature generation immediately shows you understand the performance and freshness demands of a real-time system.
Model Pipeline (Training & Evaluation): This is the "science" part.
"This block runs offline. It pulls massive, curated datasets from our Offline Feature Store to train the model(s). After training, it runs offline evaluation (using our metric from Step 1, like NDCG) to validate performance. The final, validated model asset is then saved to a Model Registry."
Model Serving (Inference): This is the online system that delivers the "Output" you defined. This block is critical.
"When a user opens their app, a request hits our Serving System. This service fetches online features from the Online Feature Store and the trained model from the Model Registry to make a prediction."
Pro-Tip: For any large-scale ranking problem (Q1-Q10), you must propose a multi-stage architecture. "At this scale, we can't score millions of articles for every user in real-time. Our Serving System will be two-stage:
Candidate Generation (Retrieval): A fast, lightweight model (e.g., matrix factorization or a two-tower model) that selects ~1,000 potentially relevant items from millions.
Ranking: A complex, feature-rich model (e.g., a Gradient Boosted Tree or DNN) that scores and re-ranks only those ~1,000 candidates to produce the final top 100."
The Feedback Loop: This is what makes the AI system learn.
"Finally, we need a Feedback Loop. The predictions and user interactions from the Serving System (e.g., 'we showed item X, user clicked it') must be logged. This new data flows back into our Data Ingestion (Kafka) block. This closes the loop, provides fresh training data, and is essential for monitoring model drift."
2. The "Strategic Focus": Pick Your "AI-Critical" Battle
You've just designed a massive, complex system. You cannot deep-dive into every single block in a 45-minute interview.
Your final, most strategic move in Phase 1 is to guide the interviewer. You must identify the most "AI-critical" part of your design, the part with the most complex trade-offs, the highest business impact, and the most interesting AI challenges.
For a News Feed (Q1): "This is a huge system. The data pipelines are standard, but the real magic is in the Ranking model. How we balance personalization, diversity, and freshness in that ranker is the hardest part. I'd like to focus my deep dive there."
For Fraud Detection (Q19): "The model itself might be a simple XGBoost, but the real challenge is the online feature engineering pipeline. Calculating features like 'user's transaction velocity vs. 30-day average' in under 50ms is the 'AI-critical' problem. I'd focus there."
For Hate Speech Detection (Q14): "The model is a solved text classifier. The critical component is the Data Pipeline, specifically our active learning and labeling strategy. How we define 'hate speech' and find new, adversarial examples is the real problem."
By this point, you've turned a vague prompt into a concrete architectural plan. You've shown the interviewer the map, and now you've pointed to the "X" where the treasure is. You're not waiting for them to ask; you're telling them what's most important. This gives you the perfect, confident transition into Phase 2, where you'll start to build.